Visualizing Android Code Execution Pt.3
In part one and part two we looked at how to visualize Android native execution in Ghidra. That’s really useful but there is another significant portion of Android, the Java layer, which does not have an amazing solution for visualizing execution.
This write-up introduces FlowFinder, an open-source web tool, which aims to provide a way to visualize Java execution via annotated control-flow graphs. This tool is still in it’s infancy - many issues are expected - please raise them in the issue tracker and I will attempt to address them as fast as possible.
.dot Files and JADX
As shown in the other visualization write-ups, Android native and iOS coverage is generally captured in the drcov file format - unfortunately this format does not translate well to the Java layer of Android.
Searching for other appropriate file formats, it was noted that the prolific Android reversing tool JADX has some underutilized functionality which produces .dot files. These .dot files are written in the DOT Language and represent a graph where each node is one basic block within a Java Classes method. This enumeration of basic blocks lends itself to capturing coverage and thus we can look to generate and annotate these files to assist in our coverage guided reverse engineering. Note that .dot files can be generated for a given class with the following jadx command:
1
2
3
4
$ jadx --single-class <com.example.Class> --raw-cfg ./example.apk

\\ Example to generate a .dot file for the MessagesNotificationManager in Facebook's Messenger application
$ jadx --single-class com.facebook.orca.notify.MessagesNotificationManager --raw-cfg ./com.facebook.orca.apk
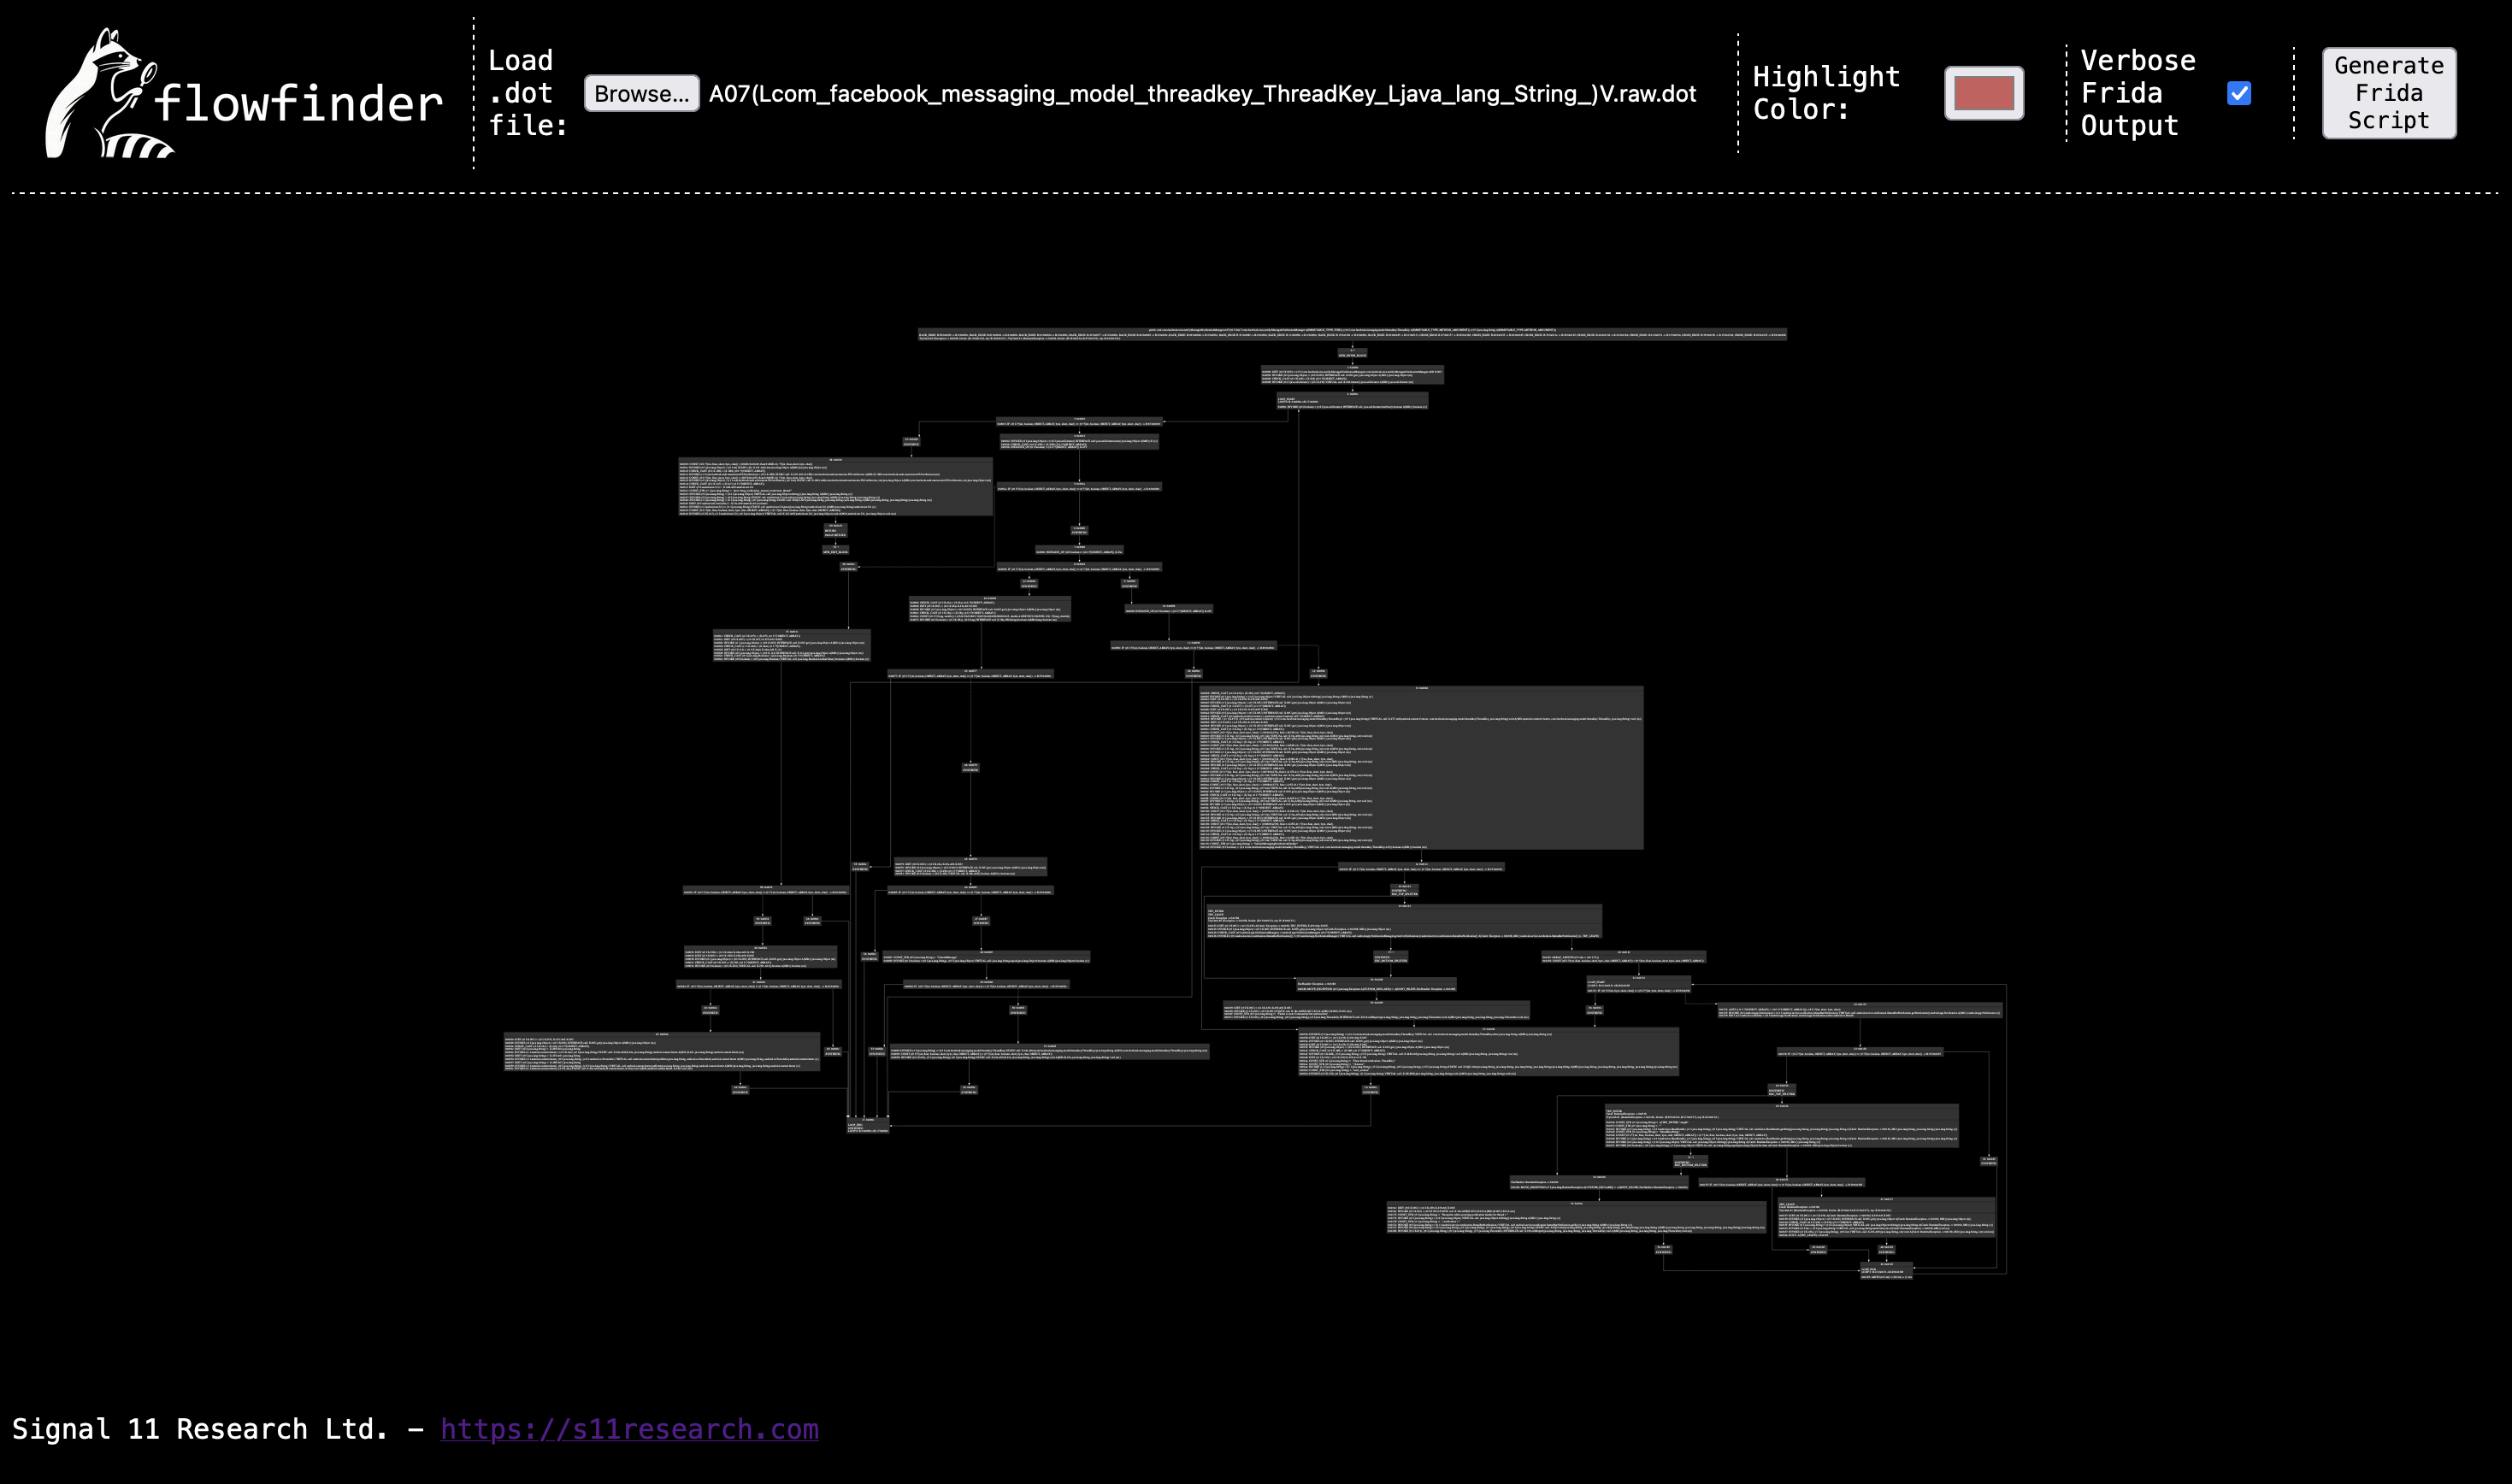
After running these commands - a number of .dot files will be generated for each method within the targeted class. The image below shows the FlowFinder tool rendering the .dot file for method A07 within the com.facebook.orca.notify.MessagesNotificationManager class.
Adding coverage to .dot files
Each of the nodes within .dot file contains all the Smali instructions per basic block (human readable Dalivk bytecode) - including all of the calls to other methods via the VIRTUAL call: and STATIC call: Smali instructions. The image below shows a basic block within our Messenger example - note that it has multiple calls to other methods.
We are able to instrument these inner calls with frida and trigger an event on their execution. Given this, our initial strategy for collecting coverage will be to identify all calls internal to the method - create the a frida script that instruments them - and report which node they are associated with when executed.
FlowFinder
At a thousand foot view - FlowFinder ingests .dot files produced by JADX and then produces a frida script that will add instrumentation which produces a .dot file annotated with execution metadata. Note that the script produced does the following:
- Enumerates all class loaders to ensure each class if found.
- Given the verbose flag - will print all inputs and outputs of instrumented methods.
- Selects the correct function via the
.overload()method in frida. - Add executed annotations to basic blocks that are implicitly executed.
- i.e If block A executes and block B is the only branch following Block A - Block B is also marked as executed - similarly if block C is the only block entering block A it is also marked as having executed.
The script that FlowFinder produces is heavily influenced by the frida-drcov.py script included in the Lighthouse visualization tool. It requires that frida be installed via pip install frida-tools and will run until the user sends a SIGINT signal - saving all collected coverage to a new flow-cov.dot file for visualization in FlowFinder. The script should be ran as follows:
1
2
3
4
5
$ python3 ./flow_script.py -D <DeviceID> <Process Name>

// Example collecting coverage using the script produced by FlowFinder for MessagesNotificationManager
$ python3 ./flow_script.py -D 91234AAC2114KK Messenger
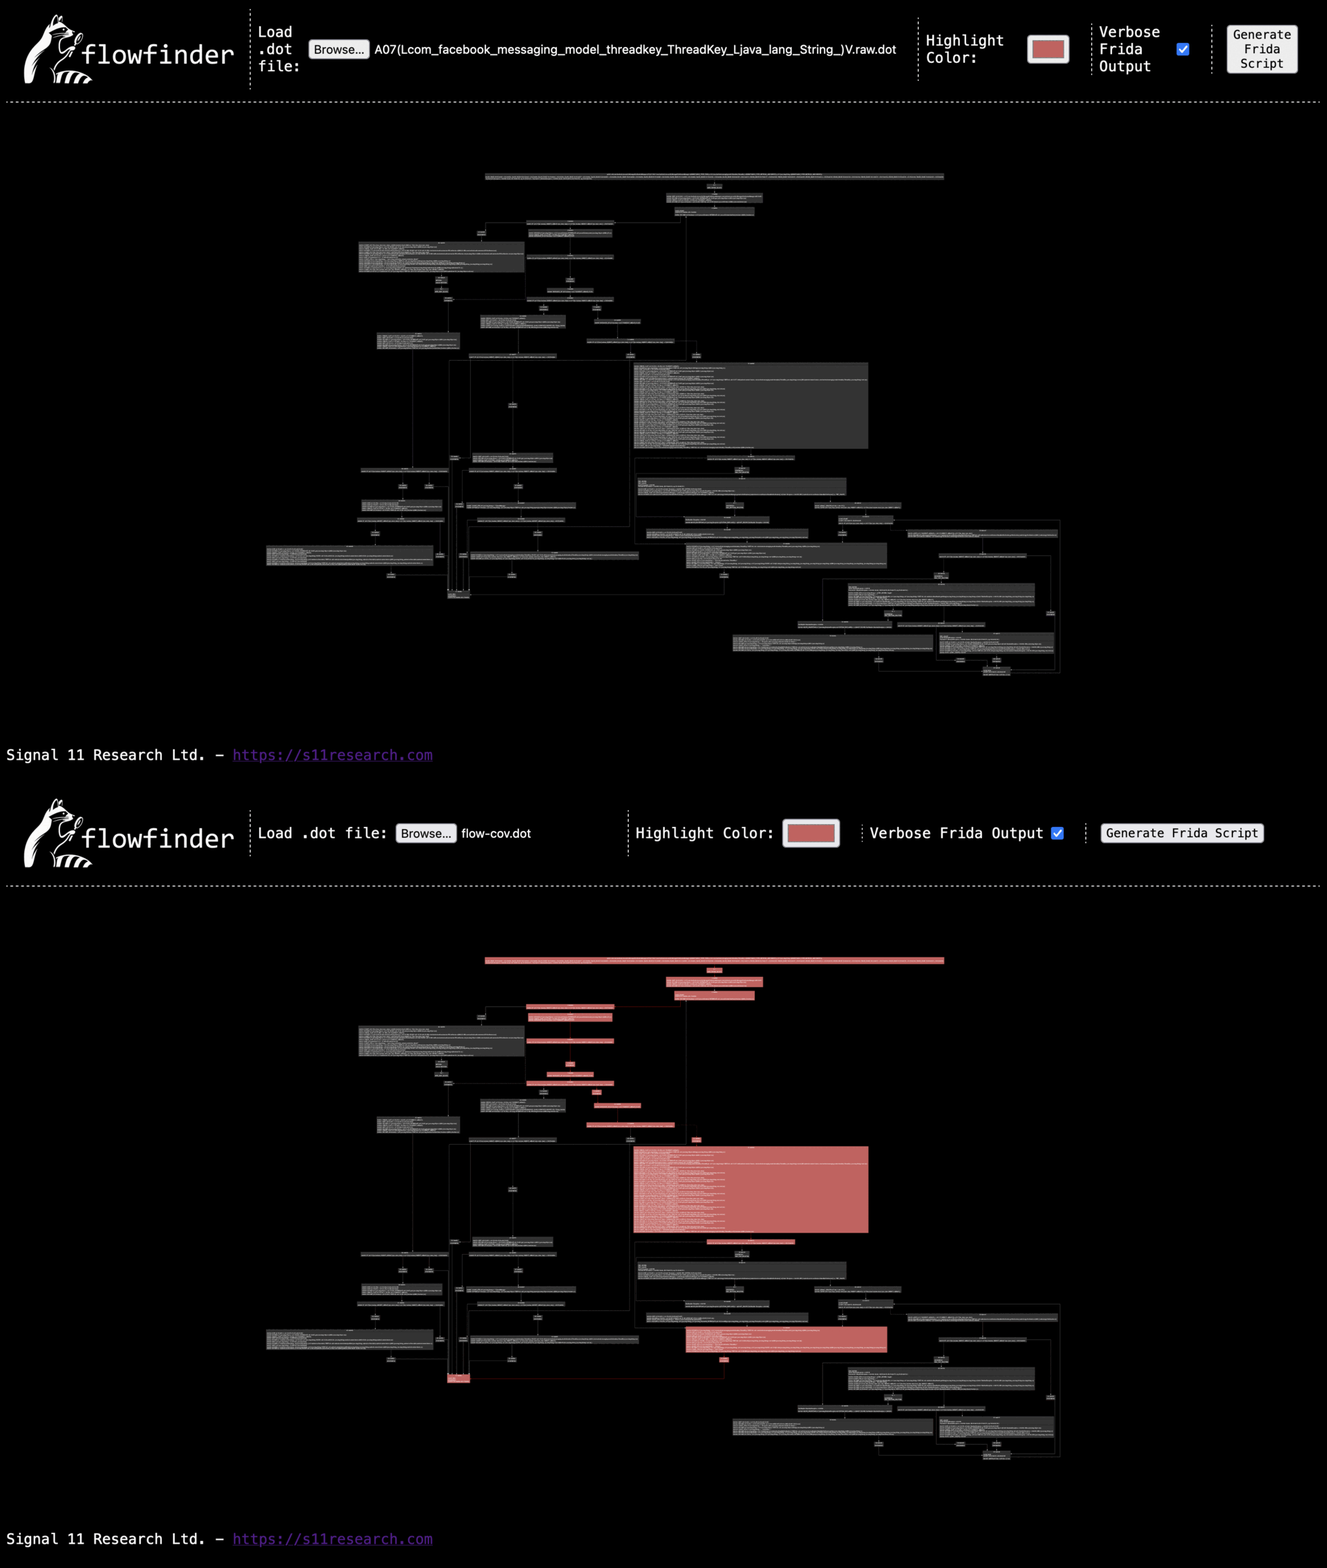
In general the view of a reverse engineer using the generated frida script would look something like the following:
Loading the produced coverage file into FlowFinder will produce results similar to those seen below:
FlowFinder Shortcomings and Improvements
There are many short comings of this method of collecting Java coverage for Android - a few that affect FlowFinder include:
- Duplicate internal calls not able to distinguish associated node
- Stacktrace does include different line numbers per call which may allow distinguishing them
- Basic blocks that do not contain any calls are not able to be instrumented
- Potential to replace entire internal implementation of analyzed method with duplicate functionality but additional instrumentation
- Multiple calls to method being analyzed reports multiple paths as one
- Potential to only begin instrumentation onEnter and complete instrumentation onLeave
- frida can be finicky
- Sometimes methods and classes just can’t be found
Java.deoptimizeEverything()could potentially solve the problem by forcing the VM to execute everything with the interpreter.
Conclusions
FlowFinder is a new tool for generating Java layer coverage for Android. It can be a useful tool to accelerate debugging and reverse engineering by showing executed basic blocks and the general flow of a Java program. It has a ways to go to being perfect - but at a minimum should help in providing insights.


