Debugging Android with LEFF
In my previous blog I wrote about using LLDB with Voltron to debug native Android binaries; I found this to be the most comparable to GDB with the popular GEF extension and it worked quite well for myself.
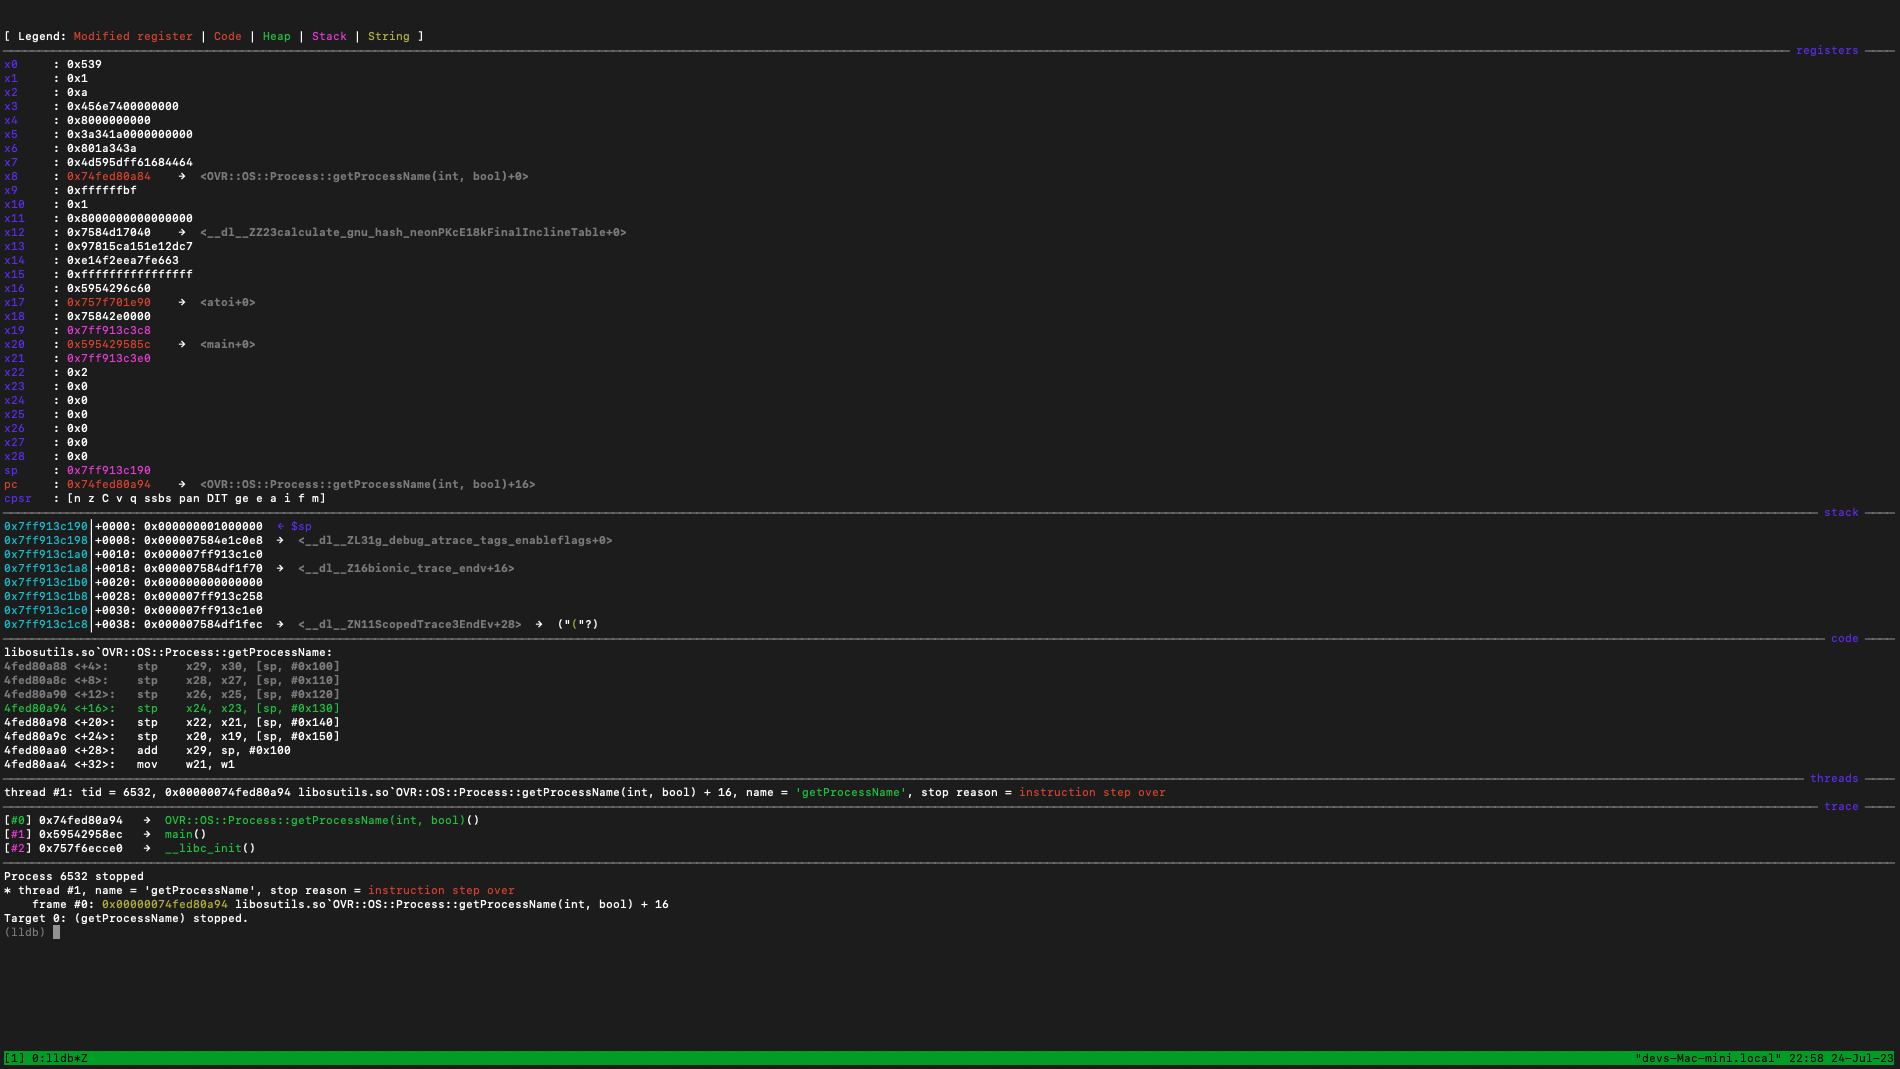
Since then I’m happy to say that Foundry Zero has released LLEF which gives a very similar experience to GEF for LLDB.
In this short write-up I’ll describe my experience with installing the tool and it’s support for Android debugging.
Pre-requisites
- Android NDK
- Grab the
lldb-serverbinary associated with your architecture
- Grab the
- Android Device
- I’m using my Quest 2 running
lldb-serverasshell
- I’m using my Quest 2 running
- lldb installed on your host
- A binary worth debugging
- I’ll use the crashing Quest 2 binary from my last write-up
Generic lldb Commands
Once you have all the pre-requisites, you’ll use the same lldb commands to debug the binary you’ve chosen whether using Voltron or LLEF. In this instance, I’ll be debugging the Quest 2 native library libosutils.so from my previous blog using my ./getProcessName binary.
1
2
3
4
5
6
7
8
9
10
11
12
13
14
15
16
17
18
19
20
21
22
23
24
// On the Android device run
$ ./lldb-server platform --server --listen 127.0.0.1:1337

// In a separate Android shell, run the binary to debug
$ ./getProcessName 1337

// Pro-tip: Introduce a prompt to continue so you can continue execution once lldb is attached.

<!-- In a separate terminal -->

// On your host run
$lldb
(lldb) platform connect connect://localhost:1337
(lldb) platform select remote-android

// In lldb attach to the process to debug
(lldb) attach getProcessName

// If successful you should see it also load in all the dependencies as well.

// Finally I'm going to add a breakpoint on the function which caused the crash in my last write-up

(lldb) b getProcessName
Breakpoint 1: where = libosutils.so`OVR::OS::Process::getProcessName(int, bool), address = 0x000000785a4aba84
Installation
LLEF appears to work out of the box for AARCH64, unlike Voltron which required a (very simple) patch. The installation is simpler than Voltron and for those unfamiliar with tmux it may offer a simpler learning curve.
The installation process (which can automatically overwrite your .lldbinit so take a backup) is simply the following:
1
2
3
git clone https://github.com/foundryzero/llef.git
cd ./llef
./install.sh
Comparison
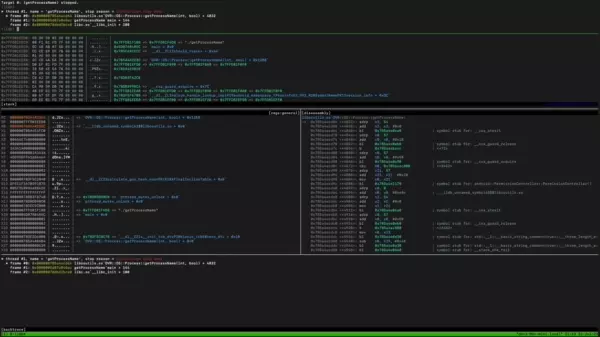
For those that want a one-to-one comparison with Voltron I’ve included two short videos stepping through my binary, hopefully this is a useful illustration.
LLEF Usage
Full-resolution video here (18 mb).
Voltron Usage
Full-resolution video here (39 mb).
Thoughts
LLEF is a really solid tool which gives the same feel as GEF within lldb, there isn’t much more to say than that. While it does share many of the same features as Voltron, it includes a few more such as pattern creation and searching, and viewing threads. I can definitely see the benefit to being able to create and search for patterns and I’m excited to use that aspect of the tool; though at time of writing I’ve had some issues with it supporting MacOS and have filed an issue on their repository (I’m sure it’s a simple fix).
Since it supported AArch64 it immediately supported Android and I had no issue jumping right into debugging. Definitely refreshing to have a tool integrate into my workflow that seamlessly. While I do love that I get to configure my Voltron terminals to my taste, I can see LLEF’s appeal to other researchers jumping straight into Android debugging with the familiar feel LLEF provides.
In conclusion I think it’s a real competitor to Voltron and I hope to get more use with it in the future; likely when I require more pattern matching support.


